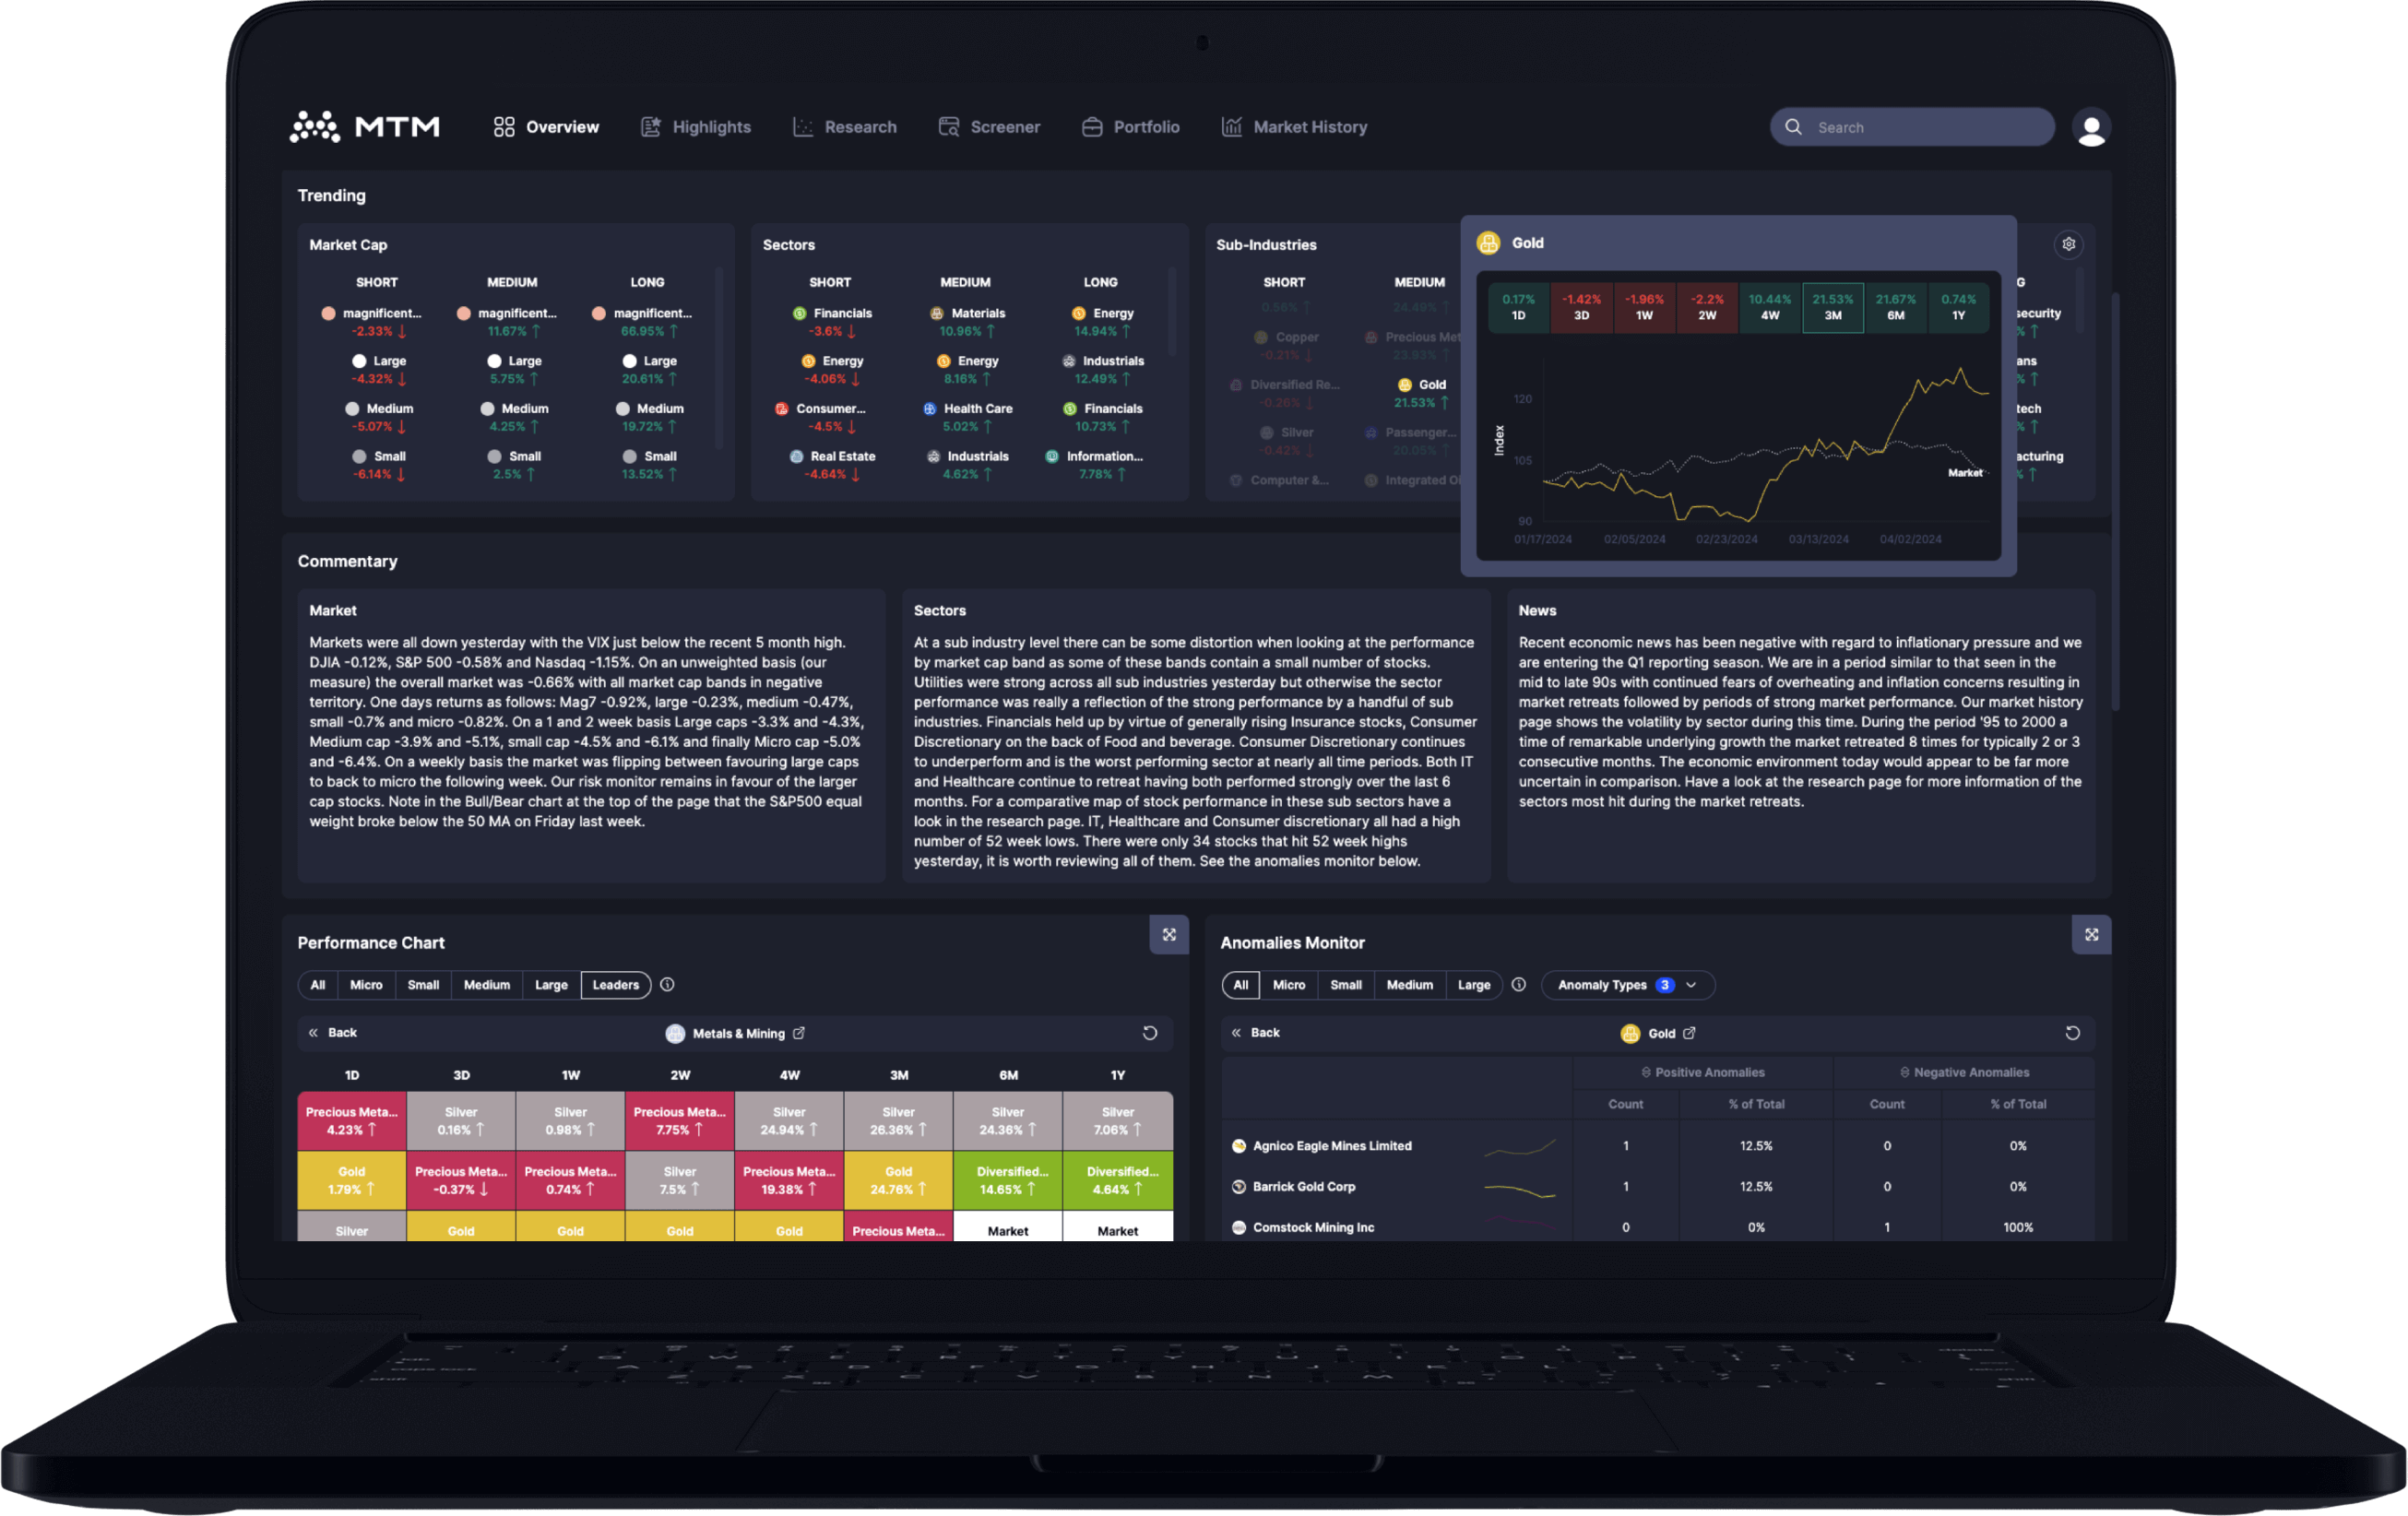
Research Tool
Compare groups and stocks effortlessly with intuitive graphs
Data-driven insights for the modern investor
Gain an edge with MTM Research, use our AI-enhanced platform to identify your next investment opportunity. We simplify comparing stocks across all market layers to support your analysis.
Discover market opportunities to compliment your investment strategy
View the market across different scales; from broad to sectors to specific concepts or technologies. Unearth new investment opportunities and compare their performance using our array of powerful tools.
Compare groups and stocks effortlessly with intuitive graphs
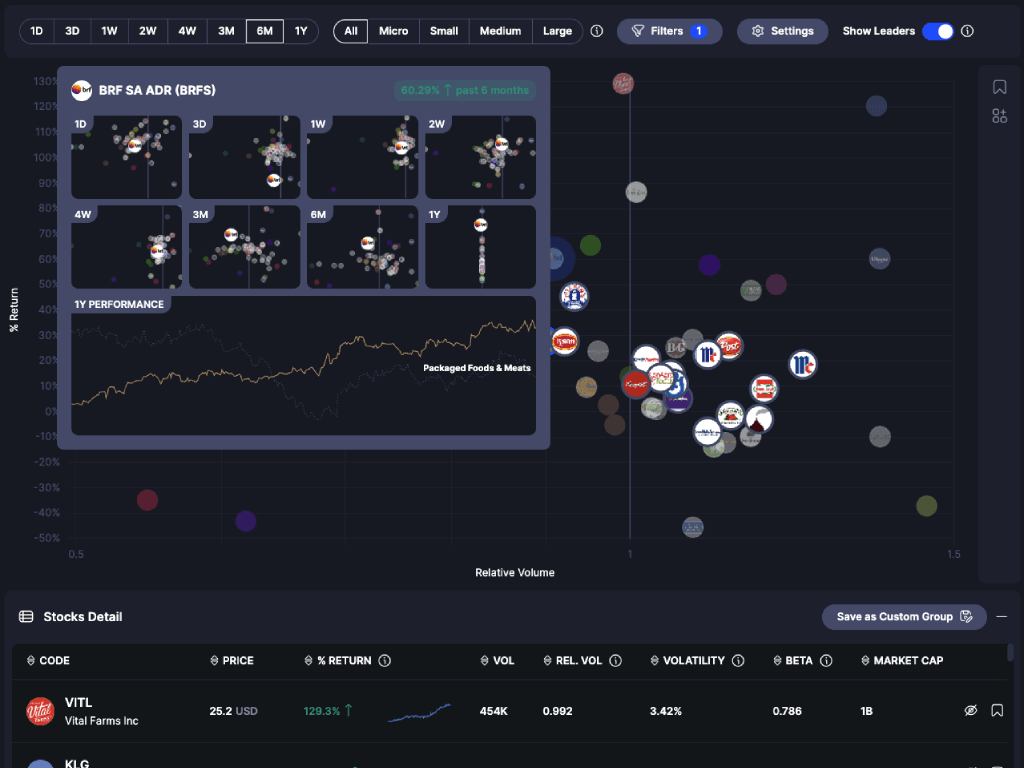
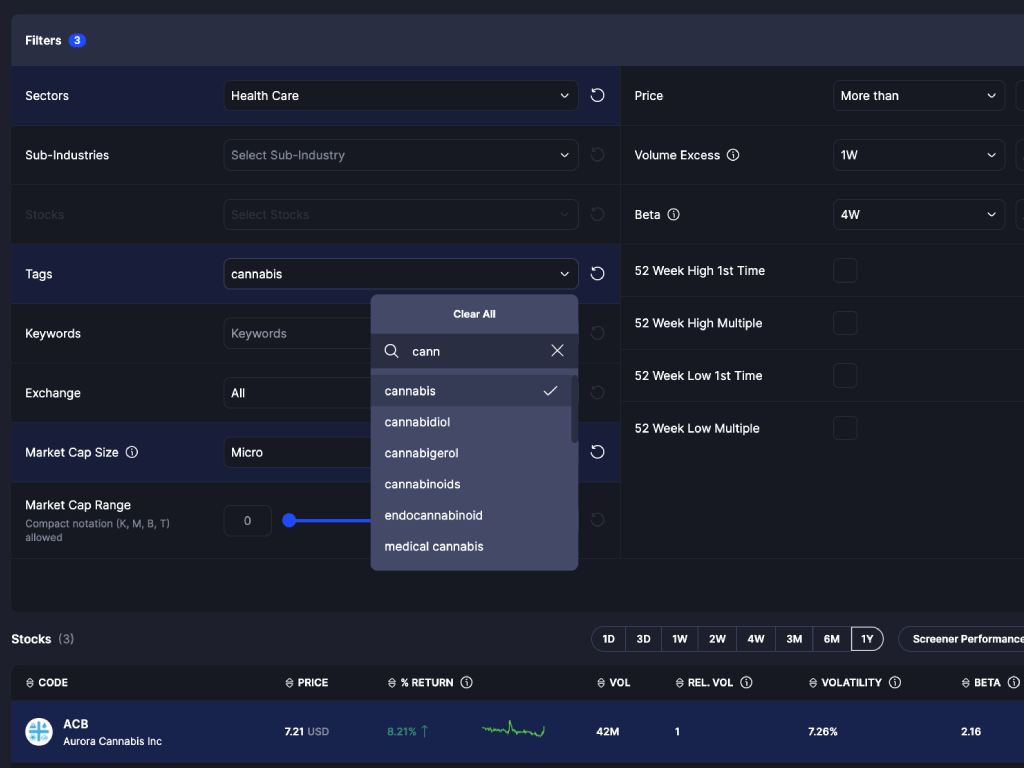
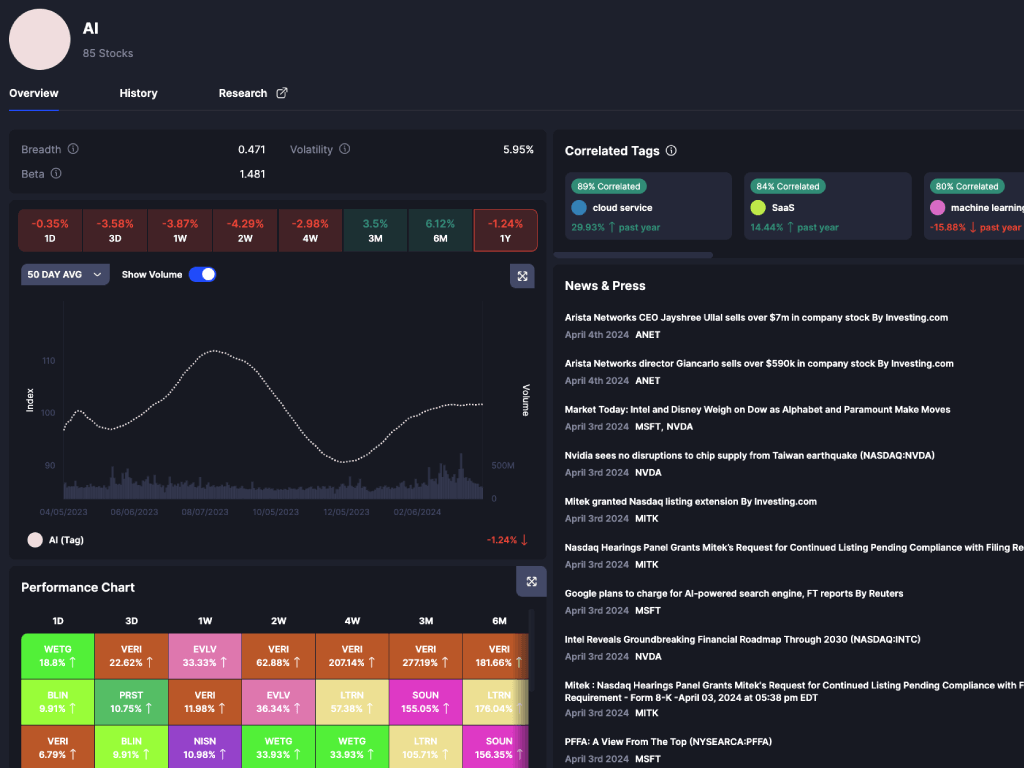
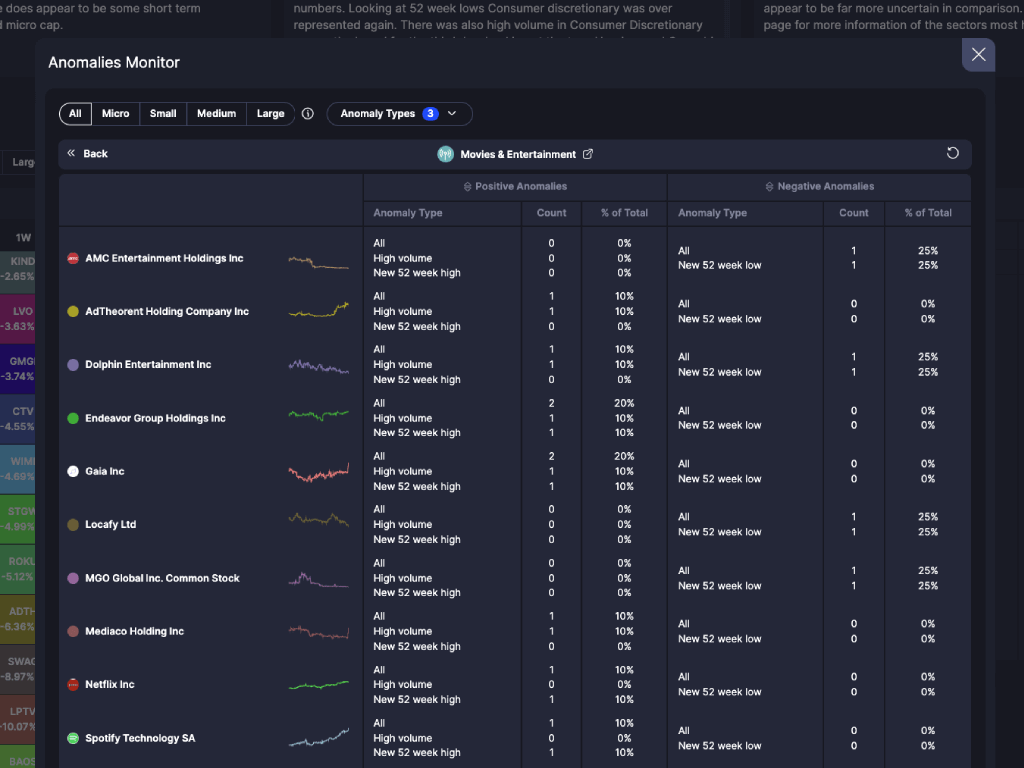
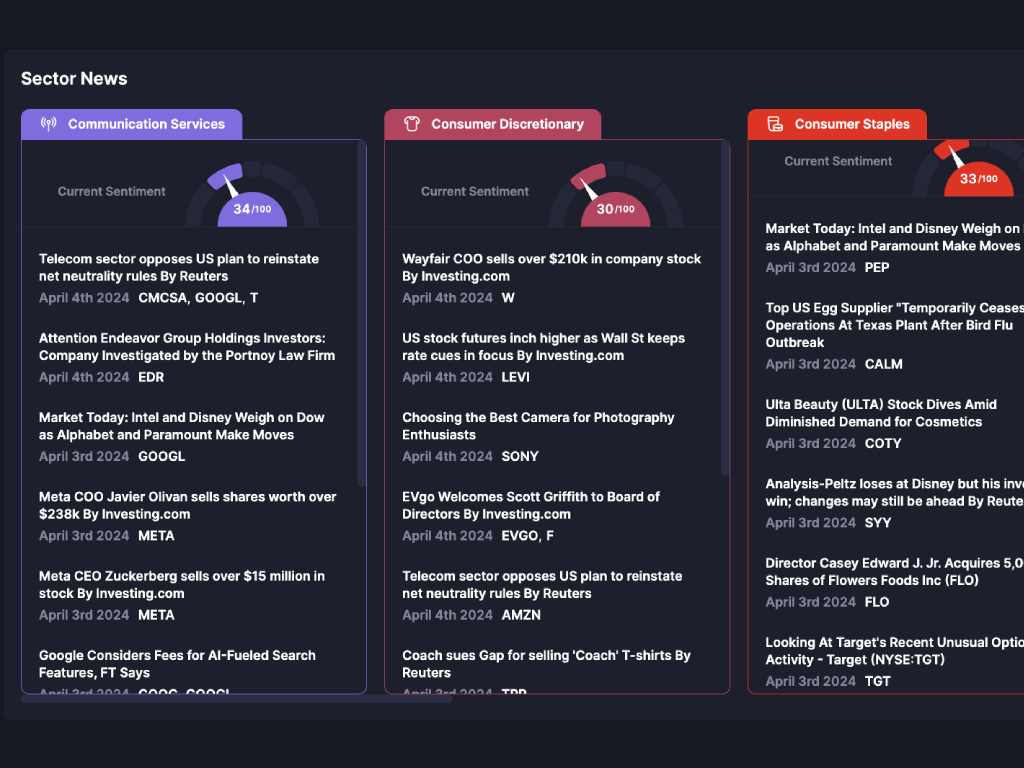
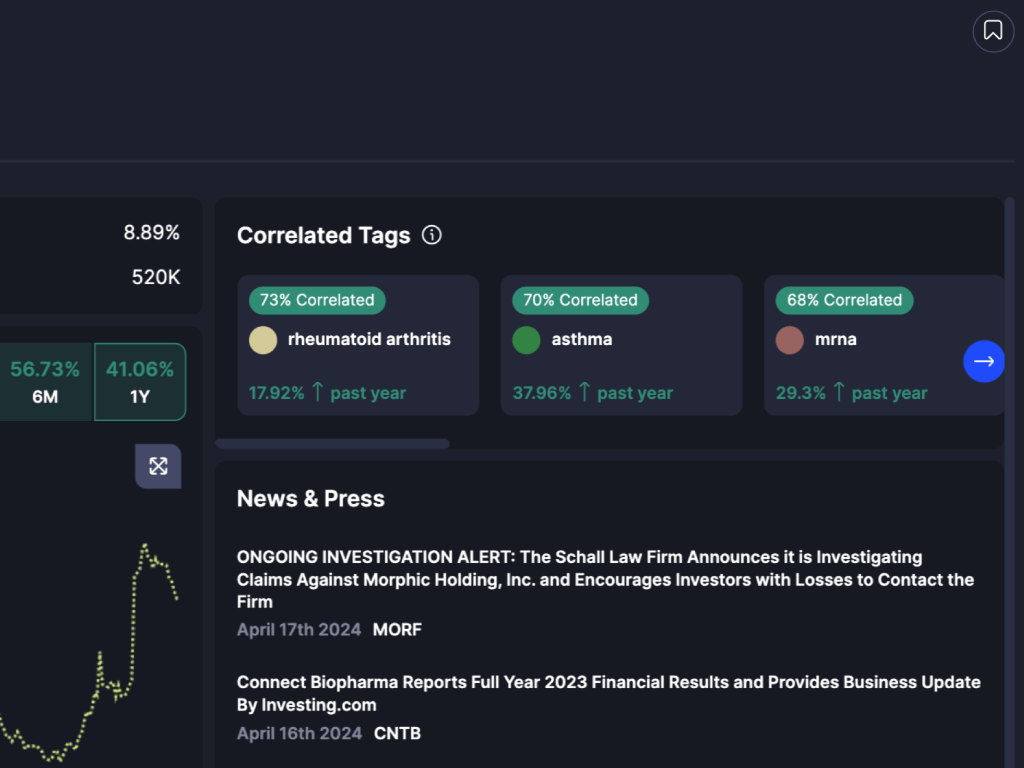
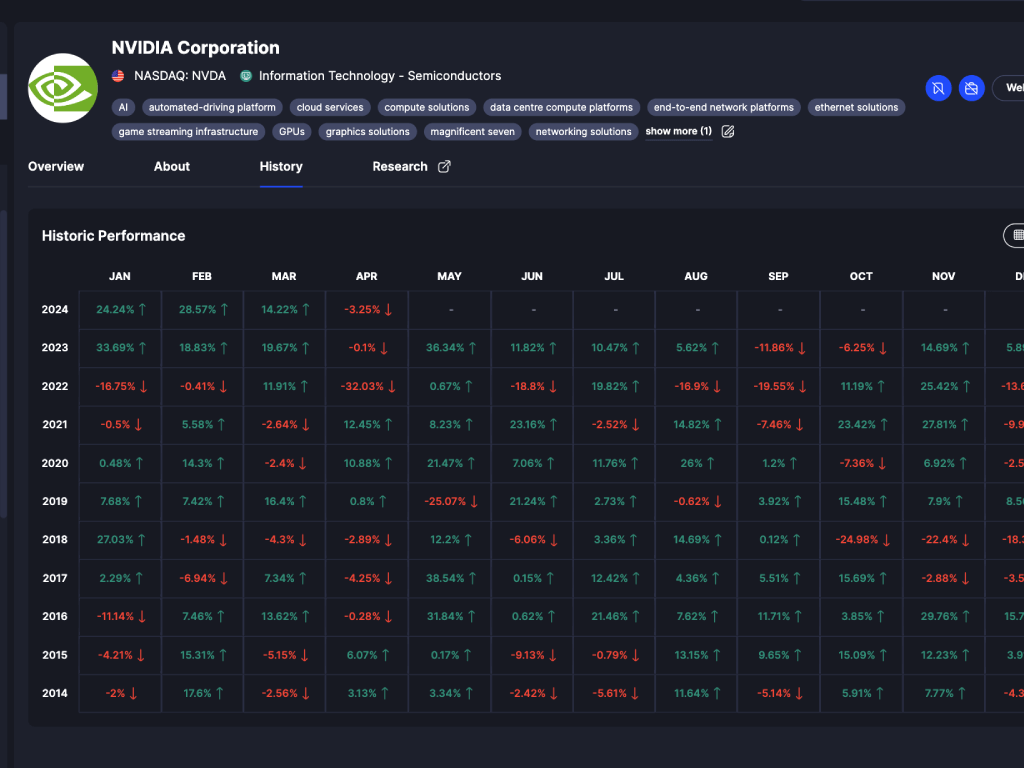
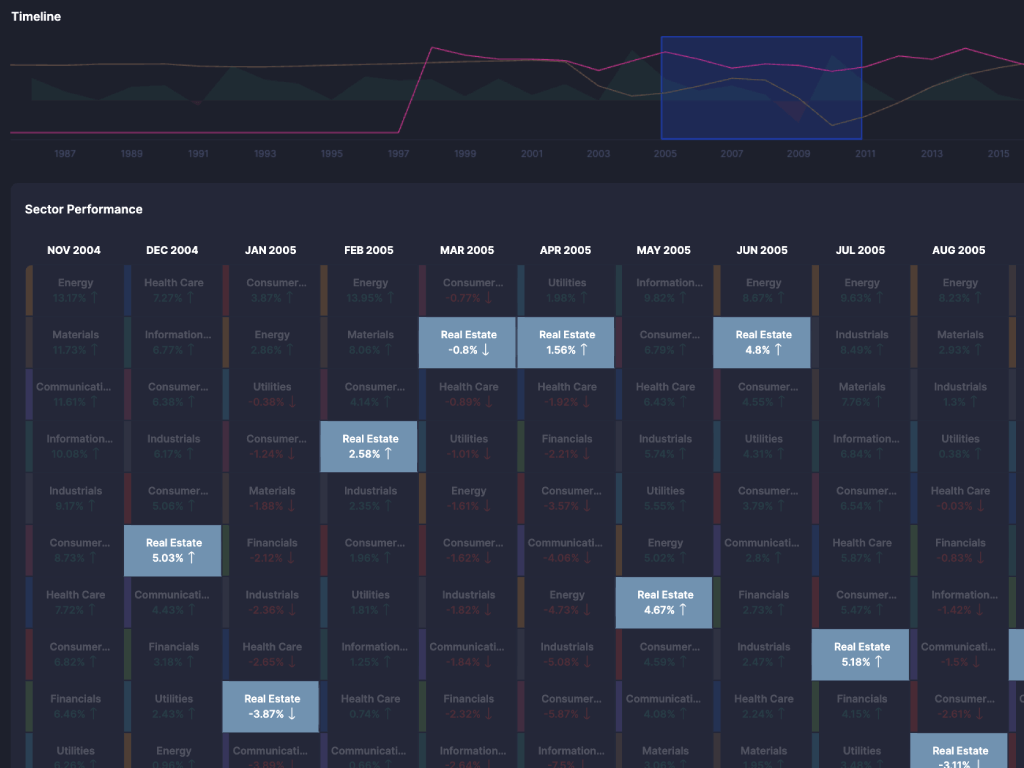
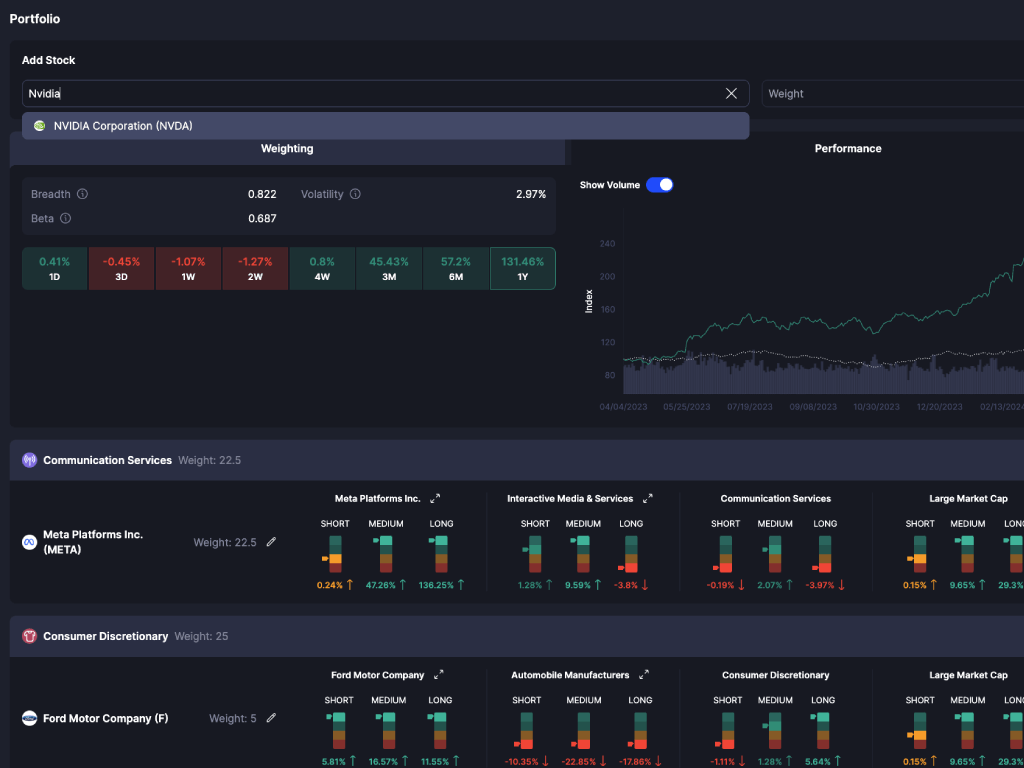
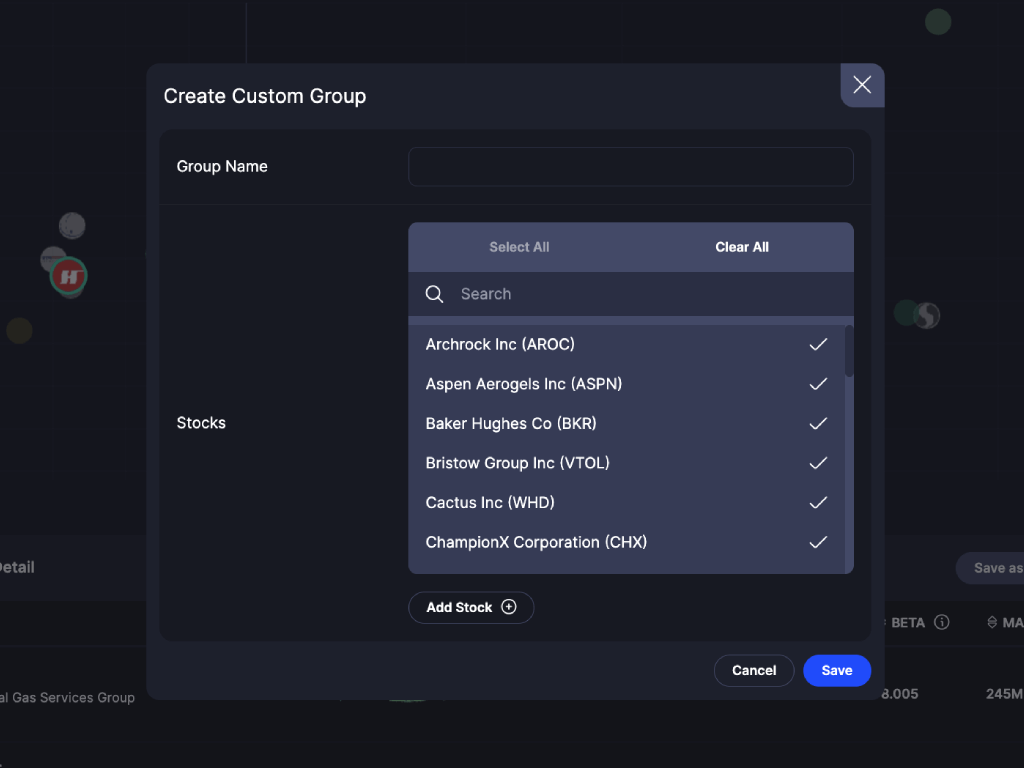
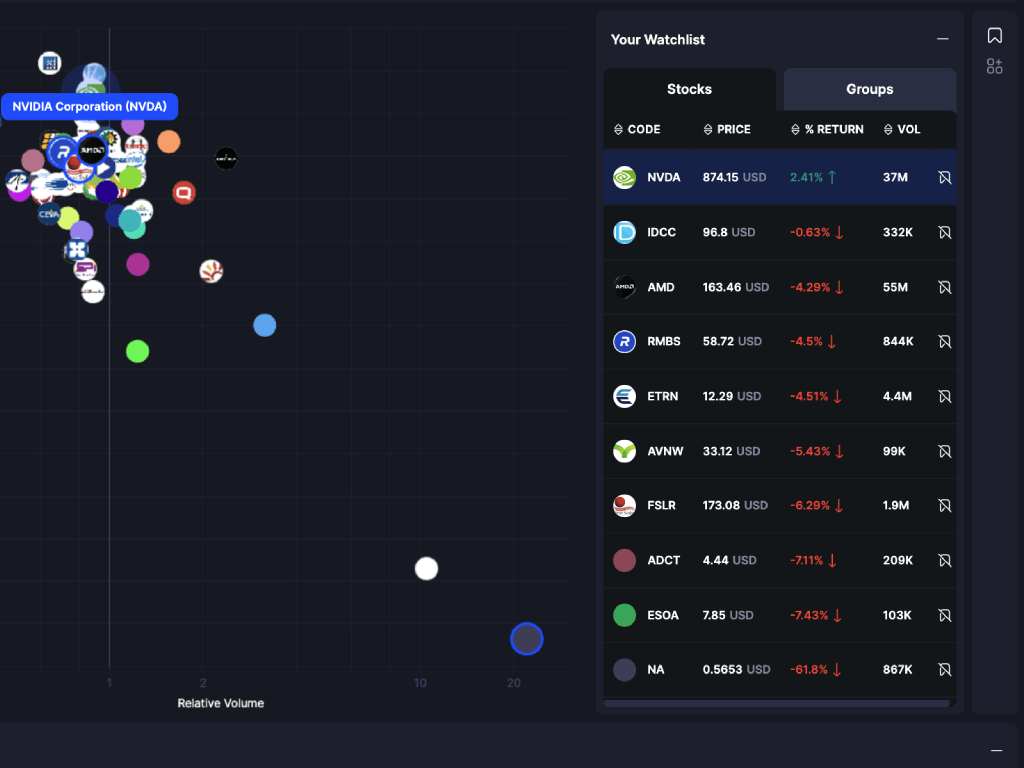
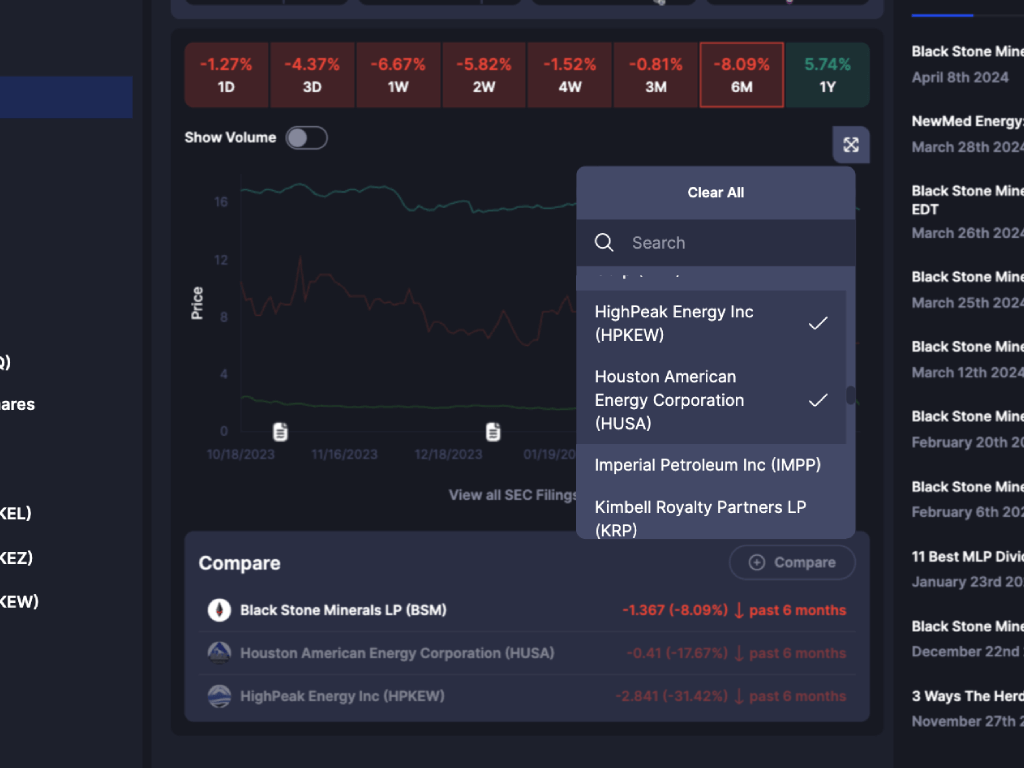
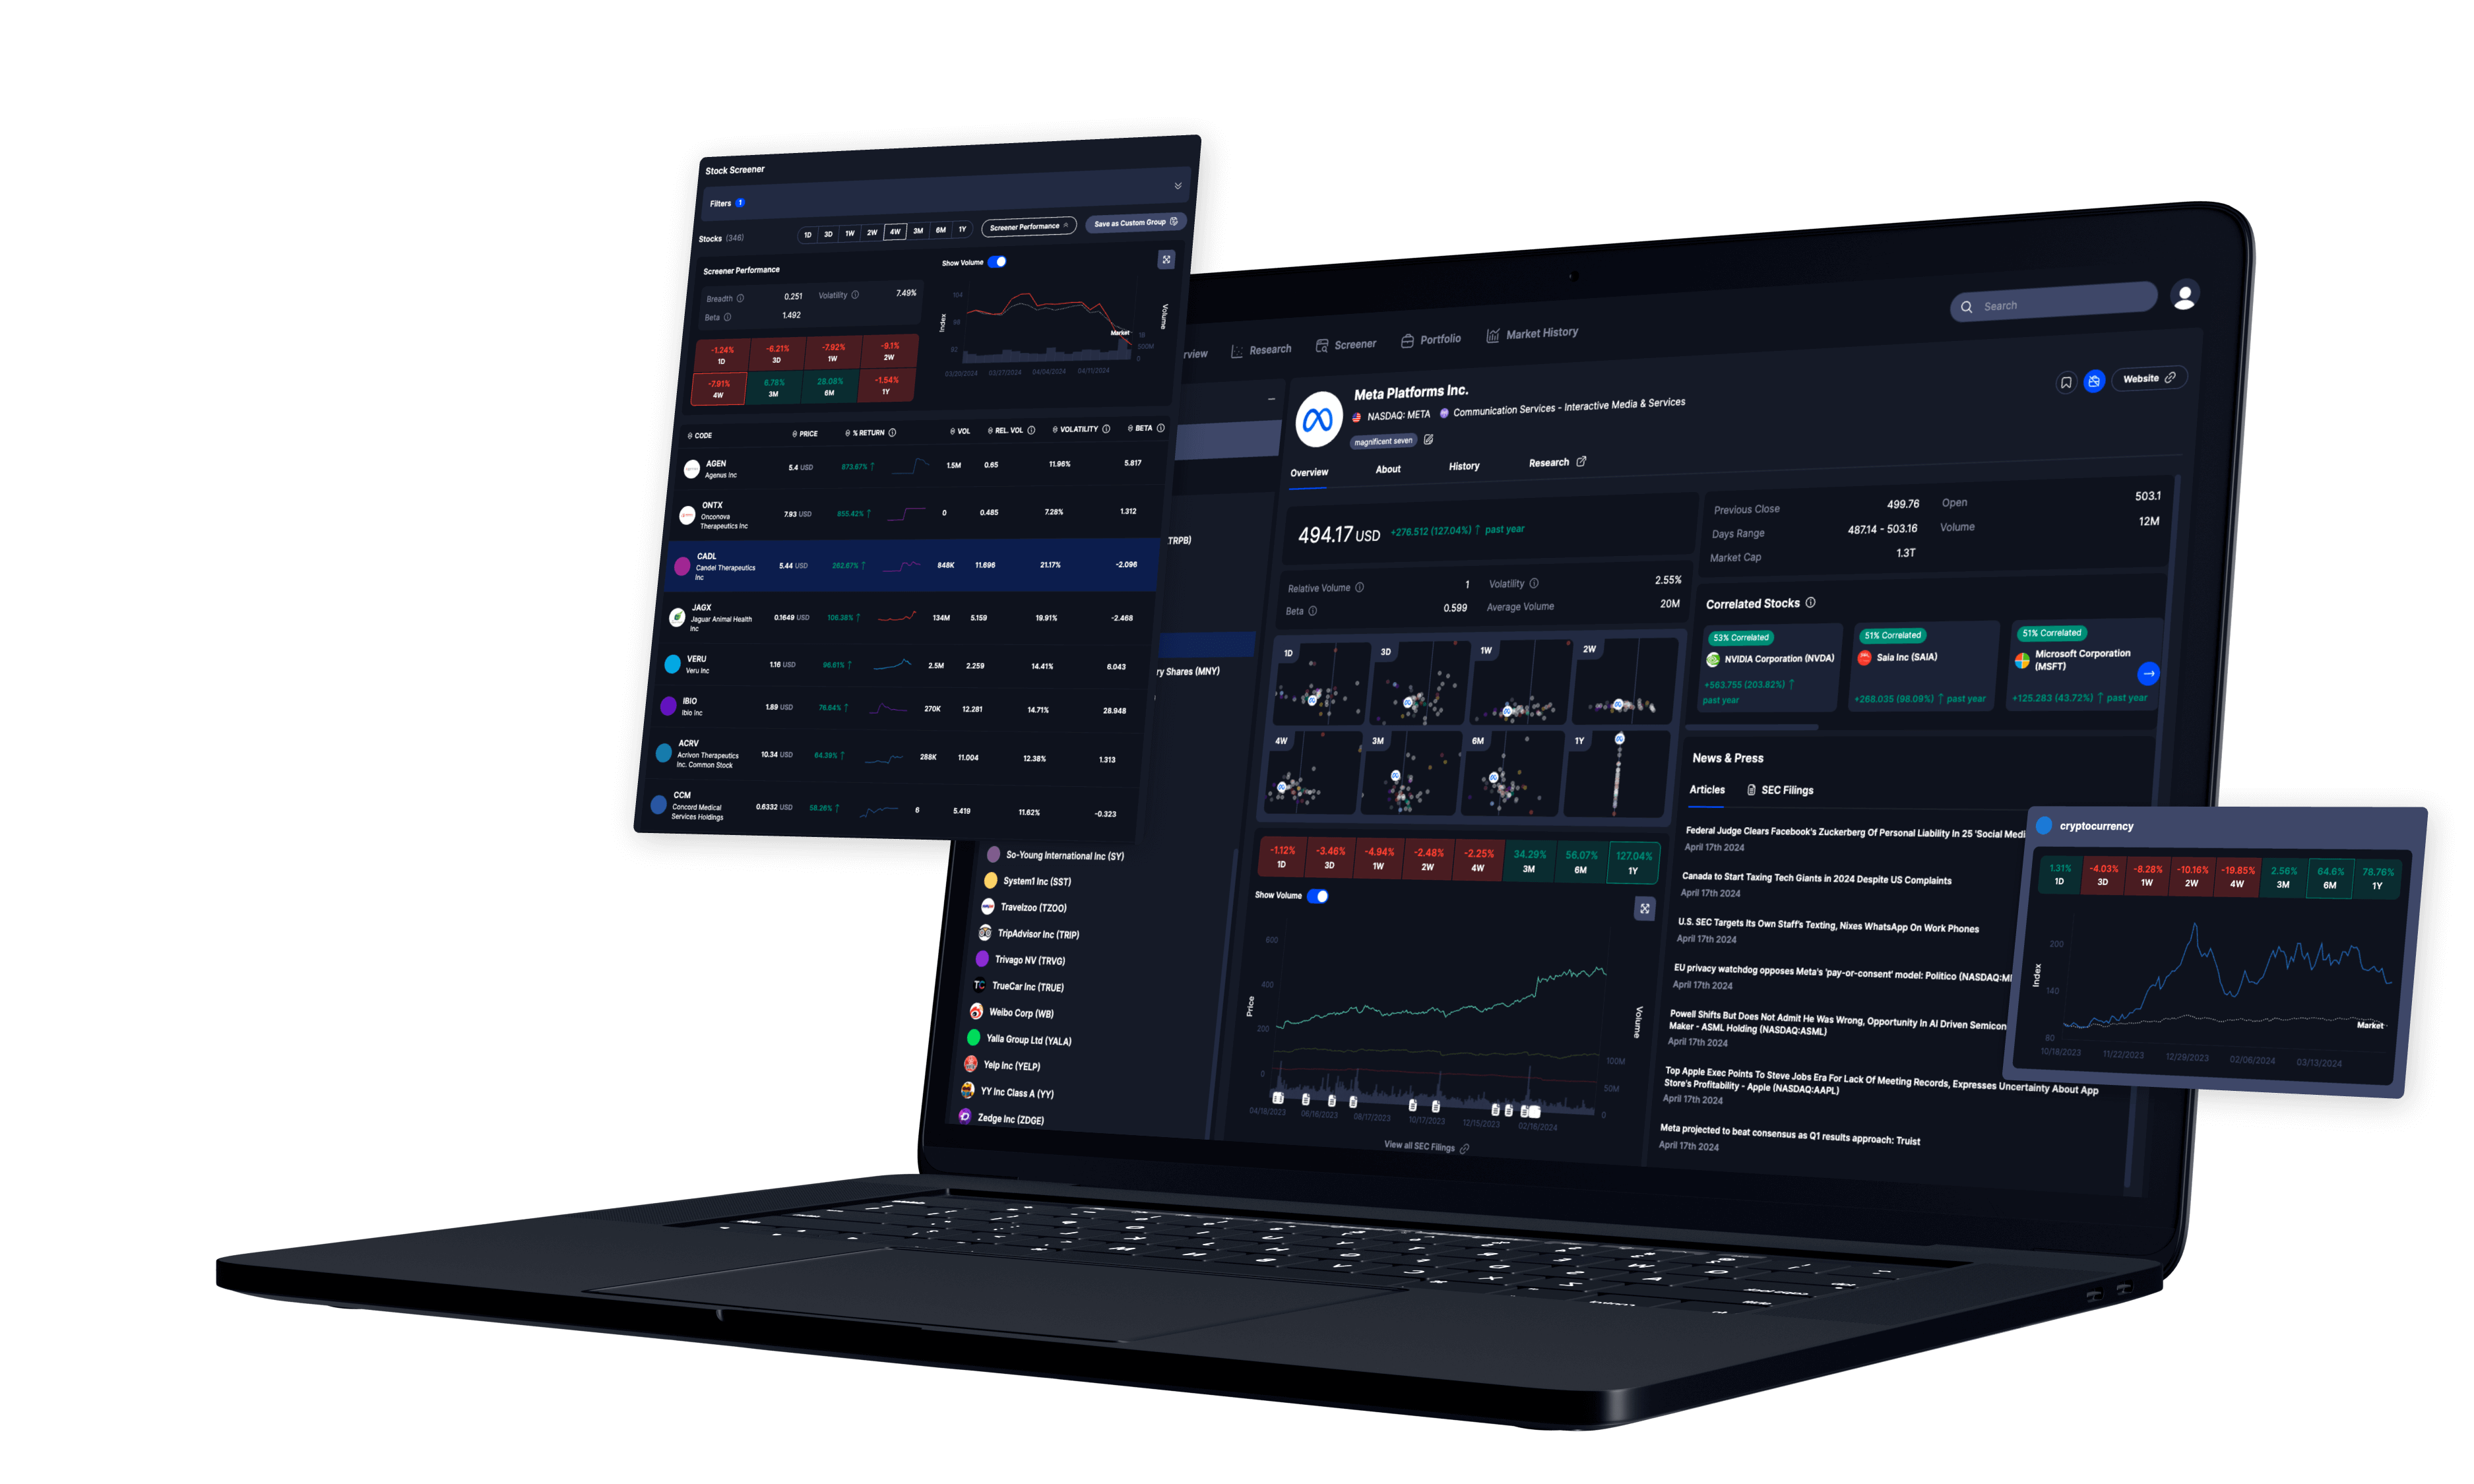
Visualize and compare stocks and groups of stocks against each other, use a range of metrics to identify stocks most suitable for your portfolio and seek out the areas responsible for driving or dragging a sector or industry. The Research tool allows you to explore the traditional sector hierarchies, or create your own custom groups and comparisons.
Isolate new groups using comprehensive market screening
The screener tool allows you to filter the market to focus on the factors or metrics important to you. Utilise either the traditional hierarchy or novel tags to create new groups of stocks, filter by market cap, or anomaly types, keywords, volumes, exchange, and many others.
Once filtered the matching stocks can be inspected and compared, or combined into a custom group so you never lose your progress.
Browse our library of novel thematic tags
Look beyond the traditional market structure with our novel thematic tags. These improve upon the conventional hierarchical structure by highlighting technologies, concepts or methodologies used by each company, and tracking their progress.
This polyhierarchical structure enables companies with broad interests to be represented in the many sectors and industries they cover, rather than being limited to a single sub-industry in the traditional hierarchy.
The tags are dynamic and will be updated as companies add new technologies or expand into new areas.
Stay ahead with the spotlight on unusual market movements
Explore which sectors, industries, and sub-industries are showing price or volume anomalies. Separate out by market capitalization size to observe which areas of the market are performing well and which continue to struggle in current economic circumstances.
Enrich your understanding with both current news and deep historical context
Access the latest news articles and SEC filings to help understanding of stock movements. Contextualize current market trends by exploring past behaviour, including macro-economic indicators and monthly sector performance.
Keep up to date with the latest news and explore the numbers behind the headlines
News articles are provided throughout the site and allow you to be informed of the latest changes relevant to your interests. The current sentiment of each sector is calculated daily based on article content; helping identify sectors that are receiving praise or critique. Company SEC filings are also provided to complement external news.
Identify the unexpected by exploring correlations between stocks, groups, and tags
Each stock, group, and tag have degrees of correlation calculated against others within their category so that you can identify which are following a similar medium-term trend and which appear to have little in common. Identify otherwise hidden relationships and gain insight into investor confidence and preferences.
Identify stocks which show cyclical performance trends
Explore each stock’s historical performance over the last decade to see which display broadly cyclical trends and which are more sensitive to wider market and societal movements.
Gain valuable context with socio-economic metrics and world event insights
Explore the historical trends across markets and observe how each sector performed during/following major events and economic conditions.
View macro-economic statistics such as interest rates, inflation, unemployment, CPI, government debt/GDP amongst many more, against the market performance over the last three decades. Then explore how each sector performed on a monthly or annual basis in response to the market conditions.
Tailor your watchlists and portfolio to suite your style
Monitor stocks and groups important to your portfolio and test your own investment theories using our custom group tool. Personalize your account with customizable portfolios, bespoke stock groups, curated watchlists, and an array of comparison tools.
Track and compare your investment performance
Compare performance through the portfolio and see where you are missing out or where you should be avoiding. Portfolio allows you to evaluate your diversification and any particular risky areas, as well as exploring if your investments are in the best performing stock in that sector, industry, or sub-industry. The tool helps identify areas of weakness and opportunities for improvement. Easily add or remove stocks and input weightings to see your portfolio statistics.
Create your own stock groups and track their performance
Create and monitor your own groups of stocks, and view their amalgamated performance statistics, including beta, breadth, volatility and returns. Dissect the market your way.
Monitor key stocks and custom groups for unexpected changes
The watchlist allow a list of stocks and list of groups to be monitored quickly and efficiently to see latest returns and identify those which have not behaved as expected. Easily add stocks as you explore the rest of the site and access the watchlist panel to review.
Make informed investments by quickly comparing stocks side-by-side
The compare tool is available through the site to help project stock prices against one another, enabling easy comparison of price movements and to expose any less obvious changes or shocks to the stock.